 |
MAK RTIspy API Documentation for HLA 1.3
|
|
MAK RTIspy API Documentation for HLA 1.3
|
A QwtPlot Widget customized for use in plotting GPS accuracies. More...
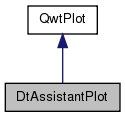
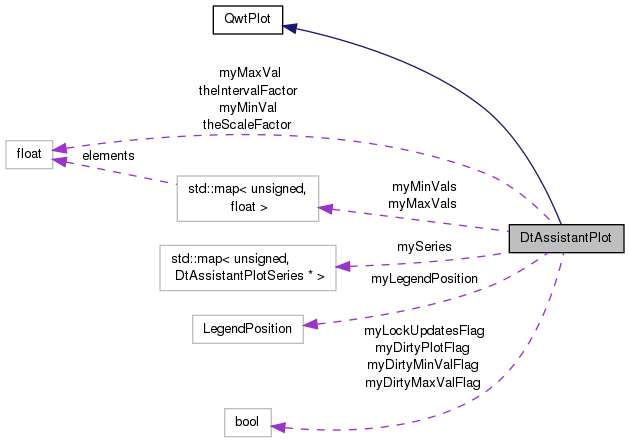
 Inheritance diagram for DtAssistantPlot: Collaboration diagram for DtAssistantPlot:
Classes | |
| class | TimeScaleDraw |
| Custom QwtScaleDraw for displaying x axis values as times. More... | |
Public Member Functions | |
| virtual void | initialize (bool showLegend, const QString &unitLabel) |
| Applies styles to the plot. | |
| virtual | ~DtAssistantPlot () |
| Virtual DTOR. | |
| virtual void | setShowTimeLabels (bool show) |
| Sets whether the X-Axis time labels are visible. | |
| virtual void | setLockUpdates (bool lock) |
| Sets whether updates. | |
| virtual DtAssistantPlotSeries * | createPlotSeries (const QColor &color, unsigned seriesId, Qt::PenStyle style, const QString &dispName=QString()) |
| Creates a new series to display on the plot. | |
| virtual DtAssistantPlotSeries * | findSeries (unsigned seriesId) |
| Finds the series with the given ID and returns it. | |
| virtual QwtLegend * | createLegend () |
| virtual void | updateSeries (unsigned seriesId, double t, double val) |
| Updates the given series with the given values Updates the series with the given values, updates the plot's scaling, and performs a replot. | |
| virtual void | updateAxisScaling () |
| Updates the y axis scaling to show the most recent n seconds Updates the y axis scaling so the most recently plotted value is visible and only myNumSecondsVisible seconds are visible (earlier plotted values will be hidden). | |
| virtual void | updateAxisScalingIfNeeded () |
| Updates the y axis scaling to show the most recent n seconds Does not rescale if maximum value can still be displayed on the graph. | |
| virtual float | getMaxVal () |
| virtual float | getMaxVal (unsigned seriesId) |
| virtual float | getMinVal () |
| virtual float | getMinVal (unsigned seriesId) |
| virtual void | setBaseTime (double baseTime) |
| virtual void | setSeriesEnabled (unsigned seriesId, bool enabled) |
| virtual void | setSeriesEnabled (QwtPlotItem *item, bool enabled) |
| virtual void | clear () |
Static Public Member Functions | |
| static DtAssistantPlot * | create (const QString &unitLabel=QString()) |
| Instantiates and initializes a new DtAssistantPlot. | |
| static DtAssistantPlot * | create (LegendPosition legendPos, const QString &unitLabel=QString()) |
| Instantiates and initializes a new DtAssistantPlot. | |
Protected Types | |
| typedef std::map< unsigned, DtAssistantPlotSeries * > | SeriesMap |
| typedef std::map< unsigned, float > | SeriesMaxValMap |
| typedef SeriesMaxValMap | SeriesMinValMap |
Protected Member Functions | |
| DtAssistantPlot (const QString &unitLabel=QString()) | |
| Protected CTOR (use create(..)) This CTOR creates a plot with no legend. | |
| DtAssistantPlot (LegendPosition legendPos, const QString &unitLabel=QString()) | |
| Protected CTOR (use create(..)) Instantiates a new plot with grid lines and scrolling. | |
| virtual void | connectToSignals () |
| virtual QPen | createPen (const QColor &color, Qt::PenStyle style=Qt::SolidLine, qreal width=0) |
| Utility method for creating a pen with the given color and width. | |
Protected Attributes | |
| SeriesMap | mySeries |
| SeriesMaxValMap | myMaxVals |
| float | myMaxVal |
| SeriesMinValMap | myMinVals |
| float | myMinVal |
| LegendPosition | myLegendPosition |
| bool | myDirtyMaxValFlag |
| bool | myDirtyMinValFlag |
| bool | myLockUpdatesFlag |
| bool | myDirtyPlotFlag |
Static Protected Attributes | |
| static const float | theScaleFactor = 1.2f |
| Constants used in scaling y axis. | |
| static const float | theIntervalFactor = 0.001f |
| Constants used in scaling y axis. | |
A QwtPlot Widget customized for use in plotting GPS accuracies.
|
protected |
|
protected |
|
protected |
|
virtual |
Virtual DTOR.
References mySeries.
|
protected |
Protected CTOR (use create(..)) This CTOR creates a plot with no legend.
Instantiates a new plot with grid lines and scrolling
| unitLabel | label for the units of the y axis. |
Referenced by create().
|
protected |
Protected CTOR (use create(..)) Instantiates a new plot with grid lines and scrolling.
| legendPos | where to position the legend relative to the plot. |
| unitLabel | label for the units of the y axis. |
|
virtual |
References myDirtyMaxValFlag, myDirtyMinValFlag, mySeries, and updateAxisScaling().
Referenced by DtAssistantPlotWidget::clear().
|
protectedvirtual |
References connect().
Referenced by initialize().
|
static |
Instantiates and initializes a new DtAssistantPlot.
| unitLabel | label for the units of the y axis. |
References DtAssistantPlot(), and initialize().
Referenced by DtAssistantPlotWidget::layoutTab().
|
static |
Instantiates and initializes a new DtAssistantPlot.
| legendPos | where to position the legend relative to the plot. |
| unitLabel | label for the units of the y axis. |
References DtAssistantPlot(), and initialize().
|
virtual |
References myLegendPosition, mySeries, and setSeriesEnabled().
Referenced by initialize().
|
protectedvirtual |
Utility method for creating a pen with the given color and width.
| color | the color to make the pen |
| style | the style of line to draw |
| width | the width of the pen |
Referenced by createPlotSeries(), and initialize().
|
virtual |
Creates a new series to display on the plot.
| color | the color of the series lines |
| seriesId | an integer ID uniquely identifying the series |
| dispName | a logical name for the series (to be displayed on the legend) |
References createPen(), findSeries(), mySeries, DtAssistantPlotSeries::setEnabled(), and DtAssistantPlotSeries::updateLegend().
Referenced by DtAssistantPlotWidget::createNewSeries().
|
virtual |
Finds the series with the given ID and returns it.
References mySeries, and NULL.
Referenced by createPlotSeries(), DtAssistantPlotWidget::setSeriesData(), and updateSeries().
|
virtual |
References myDirtyMaxValFlag, myMaxVal, and mySeries.
Referenced by updateAxisScaling(), updateAxisScalingIfNeeded(), and updateSeries().
|
virtual |
References myMaxVals.
|
virtual |
References myDirtyMinValFlag, myMinVal, and mySeries.
Referenced by updateAxisScaling(), updateAxisScalingIfNeeded(), and updateSeries().
|
virtual |
References myMinVals.
|
virtual |
Applies styles to the plot.
| showLegend | whether the plot's legend should be visible. |
| legendPos | where to position the legend relative to the plot. |
| unitLabel | label for the units of the y axis. |
References connectToSignals(), createLegend(), createPen(), setShowTimeLabels(), and updateAxisScaling().
Referenced by create().
|
virtual |
References DtAssistantPlot::TimeScaleDraw::setBaseTime().
Referenced by DtAssistantPlotWidget::updateSeries().
|
virtual |
Sets whether updates.
References myDirtyPlotFlag, myLockUpdatesFlag, and updateAxisScalingIfNeeded().
Referenced by DtAssistantPlotWidget::updateSeries().
|
virtual |
References mySeries.
Referenced by createLegend(), and DtAssistantPlotWidget::createNewSeries().
|
virtual |
References myDirtyMaxValFlag, myDirtyMinValFlag, and updateAxisScaling().
|
virtual |
Sets whether the X-Axis time labels are visible.
Referenced by initialize().
|
virtual |
Updates the y axis scaling to show the most recent n seconds Updates the y axis scaling so the most recently plotted value is visible and only myNumSecondsVisible seconds are visible (earlier plotted values will be hidden).
References getMaxVal(), getMinVal(), interval, theIntervalFactor, and theScaleFactor.
Referenced by clear(), initialize(), setSeriesEnabled(), and updateAxisScalingIfNeeded().
|
virtual |
Updates the y axis scaling to show the most recent n seconds Does not rescale if maximum value can still be displayed on the graph.
References getMaxVal(), getMinVal(), and updateAxisScaling().
Referenced by setLockUpdates(), and updateSeries().
|
virtual |
Updates the given series with the given values Updates the series with the given values, updates the plot's scaling, and performs a replot.
Does nothing if the series ID is invalid.
| seriesId | the id of the series to update |
| t | the time (x) value to update with |
| val | the value (y) value to update with |
References DtAssistantPlotSeries::addDataPoint(), findSeries(), getMaxVal(), getMinVal(), myDirtyPlotFlag, myLockUpdatesFlag, myMaxVal, myMaxVals, myMinVal, myMinVals, and updateAxisScalingIfNeeded().
Referenced by DtAssistantPlotWidget::updateSeries().
|
protected |
Referenced by clear(), getMaxVal(), and setSeriesEnabled().
|
protected |
Referenced by clear(), getMinVal(), and setSeriesEnabled().
|
protected |
Referenced by setLockUpdates(), and updateSeries().
|
protected |
Referenced by createLegend().
|
protected |
Referenced by setLockUpdates(), and updateSeries().
|
protected |
Referenced by getMaxVal(), and updateSeries().
|
protected |
Referenced by getMaxVal(), and updateSeries().
|
protected |
Referenced by getMinVal(), and updateSeries().
|
protected |
Referenced by getMinVal(), and updateSeries().
|
protected |
Referenced by clear(), createLegend(), createPlotSeries(), findSeries(), getMaxVal(), getMinVal(), setSeriesEnabled(), and ~DtAssistantPlot().
|
staticprotected |
Constants used in scaling y axis.
Referenced by updateAxisScaling().
|
staticprotected |
Constants used in scaling y axis.
Referenced by updateAxisScaling().