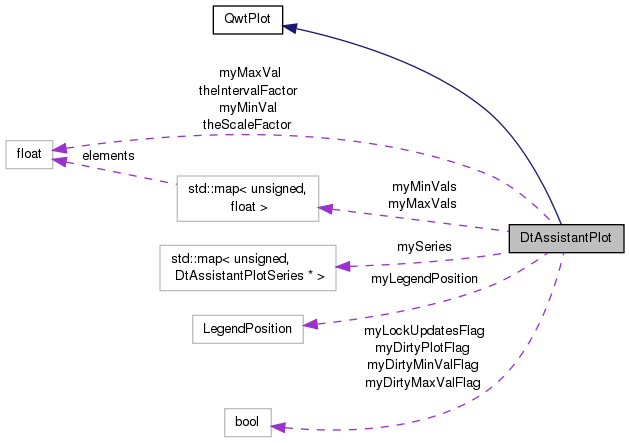
A QwtPlot Widget customized for use in plotting GPS accuracies.
More...
Public Member Functions |
| virtual void | initialize (bool showLegend, const QString &unitLabel) |
| | Applies styles to the plot.
|
| virtual | ~DtAssistantPlot () |
| | Virtual DTOR.
|
| virtual void | setShowTimeLabels (bool show) |
| | Sets whether the X-Axis time labels are visible.
|
| virtual void | setLockUpdates (bool lock) |
| | Sets whether updates.
|
| virtual DtAssistantPlotSeries * | createPlotSeries (const QColor &color, unsigned seriesId, Qt::PenStyle style, const QString &dispName=QString()) |
| | Creates a new series to display on the plot.
|
| virtual DtAssistantPlotSeries * | findSeries (unsigned seriesId) |
| | Finds the series with the given ID and returns it.
|
| virtual QwtLegend * | createLegend () |
| virtual void | updateSeries (unsigned seriesId, double t, double val) |
| | Updates the given series with the given values Updates the series with the given values, updates the plot's scaling, and performs a replot.
|
| virtual void | updateAxisScaling () |
| | Updates the y axis scaling to show the most recent n seconds Updates the y axis scaling so the most recently plotted value is visible and only myNumSecondsVisible seconds are visible (earlier plotted values will be hidden).
|
| virtual void | updateAxisScalingIfNeeded () |
| | Updates the y axis scaling to show the most recent n seconds Does not rescale if maximum value can still be displayed on the graph.
|
| virtual float | getMaxVal () |
| virtual float | getMaxVal (unsigned seriesId) |
| virtual float | getMinVal () |
| virtual float | getMinVal (unsigned seriesId) |
| virtual void | setBaseTime (double baseTime) |
| virtual void | setSeriesEnabled (unsigned seriesId, bool enabled) |
| virtual void | setSeriesEnabled (QwtPlotItem *item, bool enabled) |
| virtual void | clear () |
Protected Member Functions |
| | DtAssistantPlot (const QString &unitLabel=QString()) |
| | Protected CTOR (use create(..)) This CTOR creates a plot with no legend.
|
| | DtAssistantPlot (LegendPosition legendPos, const QString &unitLabel=QString()) |
| | Protected CTOR (use create(..)) Instantiates a new plot with grid lines and scrolling.
|
| virtual void | connectToSignals () |
| virtual QPen | createPen (const QColor &color, Qt::PenStyle style=Qt::SolidLine, qreal width=0) |
| | Utility method for creating a pen with the given color and width.
|
Static Protected Attributes |
|
| static const float | theScaleFactor |
| | Constants used in scaling y axis.
|
| static const float | theIntervalFactor |
| | Constants used in scaling y axis.
|
Detailed Description
A QwtPlot Widget customized for use in plotting GPS accuracies.
Member Typedef Documentation
Constructor & Destructor Documentation
| virtual DtAssistantPlot::~DtAssistantPlot |
( |
| ) |
|
|
virtual |
| DtAssistantPlot::DtAssistantPlot |
( |
const QString & |
unitLabel = QString() | ) |
|
|
protected |
Protected CTOR (use create(..)) This CTOR creates a plot with no legend.
Instantiates a new plot with grid lines and scrolling
- Parameters
-
| unitLabel | label for the units of the y axis. |
| DtAssistantPlot::DtAssistantPlot |
( |
LegendPosition |
legendPos, |
|
|
const QString & |
unitLabel = QString() |
|
) |
| |
|
protected |
Protected CTOR (use create(..)) Instantiates a new plot with grid lines and scrolling.
- Parameters
-
| legendPos | where to position the legend relative to the plot. |
| unitLabel | label for the units of the y axis. |
Member Function Documentation
| virtual void DtAssistantPlot::clear |
( |
| ) |
|
|
virtual |
| virtual void DtAssistantPlot::connectToSignals |
( |
| ) |
|
|
protectedvirtual |
| static DtAssistantPlot* DtAssistantPlot::create |
( |
const QString & |
unitLabel = QString() | ) |
|
|
static |
Instantiates and initializes a new DtAssistantPlot.
- Parameters
-
| unitLabel | label for the units of the y axis. |
| static DtAssistantPlot* DtAssistantPlot::create |
( |
LegendPosition |
legendPos, |
|
|
const QString & |
unitLabel = QString() |
|
) |
| |
|
static |
Instantiates and initializes a new DtAssistantPlot.
- Parameters
-
| legendPos | where to position the legend relative to the plot. |
| unitLabel | label for the units of the y axis. |
| virtual QwtLegend* DtAssistantPlot::createLegend |
( |
| ) |
|
|
virtual |
| virtual QPen DtAssistantPlot::createPen |
( |
const QColor & |
color, |
|
|
Qt::PenStyle |
style = Qt::SolidLine, |
|
|
qreal |
width = 0 |
|
) |
| |
|
protectedvirtual |
Utility method for creating a pen with the given color and width.
- Parameters
-
| color | the color to make the pen |
| style | the style of line to draw |
| width | the width of the pen |
| virtual DtAssistantPlotSeries* DtAssistantPlot::createPlotSeries |
( |
const QColor & |
color, |
|
|
unsigned |
seriesId, |
|
|
Qt::PenStyle |
style, |
|
|
const QString & |
dispName = QString() |
|
) |
| |
|
virtual |
Creates a new series to display on the plot.
- Parameters
-
| color | the color of the series lines |
| seriesId | an integer ID uniquely identifying the series |
| dispName | a logical name for the series (to be displayed on the legend) |
Finds the series with the given ID and returns it.
- Returns
- returns the series with the given ID or NULL if there wasn't one
| virtual float DtAssistantPlot::getMaxVal |
( |
| ) |
|
|
virtual |
| virtual float DtAssistantPlot::getMaxVal |
( |
unsigned |
seriesId | ) |
|
|
virtual |
| virtual float DtAssistantPlot::getMinVal |
( |
| ) |
|
|
virtual |
| virtual float DtAssistantPlot::getMinVal |
( |
unsigned |
seriesId | ) |
|
|
virtual |
| virtual void DtAssistantPlot::initialize |
( |
bool |
showLegend, |
|
|
const QString & |
unitLabel |
|
) |
| |
|
virtual |
Applies styles to the plot.
- Parameters
-
| showLegend | whether the plot's legend should be visible. |
| legendPos | where to position the legend relative to the plot. |
| unitLabel | label for the units of the y axis. |
| virtual void DtAssistantPlot::setBaseTime |
( |
double |
baseTime | ) |
|
|
virtual |
| virtual void DtAssistantPlot::setLockUpdates |
( |
bool |
lock | ) |
|
|
virtual |
| virtual void DtAssistantPlot::setSeriesEnabled |
( |
unsigned |
seriesId, |
|
|
bool |
enabled |
|
) |
| |
|
virtual |
| virtual void DtAssistantPlot::setSeriesEnabled |
( |
QwtPlotItem * |
item, |
|
|
bool |
enabled |
|
) |
| |
|
virtual |
| virtual void DtAssistantPlot::setShowTimeLabels |
( |
bool |
show | ) |
|
|
virtual |
Sets whether the X-Axis time labels are visible.
| virtual void DtAssistantPlot::updateAxisScaling |
( |
| ) |
|
|
virtual |
Updates the y axis scaling to show the most recent n seconds Updates the y axis scaling so the most recently plotted value is visible and only myNumSecondsVisible seconds are visible (earlier plotted values will be hidden).
| virtual void DtAssistantPlot::updateAxisScalingIfNeeded |
( |
| ) |
|
|
virtual |
Updates the y axis scaling to show the most recent n seconds Does not rescale if maximum value can still be displayed on the graph.
| virtual void DtAssistantPlot::updateSeries |
( |
unsigned |
seriesId, |
|
|
double |
t, |
|
|
double |
val |
|
) |
| |
|
virtual |
Updates the given series with the given values Updates the series with the given values, updates the plot's scaling, and performs a replot.
Does nothing if the series ID is invalid.
- Parameters
-
| seriesId | the id of the series to update |
| t | the time (x) value to update with |
| val | the value (y) value to update with |
Member Data Documentation
| bool DtAssistantPlot::myDirtyMaxValFlag |
|
protected |
| bool DtAssistantPlot::myDirtyMinValFlag |
|
protected |
| bool DtAssistantPlot::myDirtyPlotFlag |
|
protected |
| LegendPosition DtAssistantPlot::myLegendPosition |
|
protected |
| bool DtAssistantPlot::myLockUpdatesFlag |
|
protected |
| float DtAssistantPlot::myMaxVal |
|
protected |
| float DtAssistantPlot::myMinVal |
|
protected |
| const float DtAssistantPlot::theIntervalFactor |
|
staticprotected |
Constants used in scaling y axis.
| const float DtAssistantPlot::theScaleFactor |
|
staticprotected |
Constants used in scaling y axis.
The documentation for this class was generated from the following file:



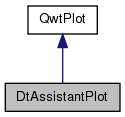
 Inheritance diagram for DtAssistantPlot: