 |
VR-Forces Developer's Guide
|


All Classes Namespaces Files Functions Variables Typedefs Enumerations Enumerator Properties Friends Macros Groups Pages
|
VR-Forces Developer's Guide
|
The VR-Forces GUI has the ability to show the performance of the connected simulation engines through use of the Performance Monitor panel.
This panel gives an overview of where the sim engines are spending their time each frame. This can be helpful as you develop scenarios and plug-ins and want to understand what the performance bottlenecks are.
Use of the Performance Monitor panel is described in the Users Guide. This section, however, is specifically for developers who desire a greater understanding of what each of the statistics tells them.
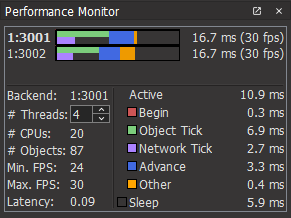
The bars on the top illustrate the average the sim engines are spending on different activities every frame. The colors each correspond to one of the colored sections found in the VR-Forces Simulation Engine Sequence Diagram on the VR-Forces Simulation Engine Architecture page.
The Threading Model section describes the tasks performed in each of these sections.
(Latency indicates the length of time it takes to send a ping message to the sim. engine and then receive a reply. There is some internal overhead on top of a regular ping.)
When the frame rate drops, you will notice one or more of these sections getting larger compared to the others. Frequently it is the Object Tick that is an issue first. This is where each entity is simulated. When this happens, the first thing to consider is allocating more simulation threads. This can be configured either in vrfSim.mtl, or by increasing the number of threads on the left side of the Performance Monitor panel.
You will also notice that the Network Tick section is running in parallel to the Object Tick. This is because these threads run concurrently. If you see the Network Tick section is longer than Object Tick, this means that network updates are consuming more time than the simulation of your entities. In this case, you can increase the number of network threads in vrfSim.mtl. You might also investigate why there are so many updates on the network.
Occassionally, you might see the Other section growing larger. This section just represents all time in which the sim engine was actively running (i.e. not sleeping), but not in any of the sections above. Navigation operations can fall into this section, so if you have a large number of ground entities moving in navigation areas, this could be the cause. Also, some plug-ins can perform operations that fall into this section. If you are trying to understand why this section is growing, it may be worth disabling plug-ins and seeing if it is still occuring.
If you would like to see even more details of your sim performance, you can also use Tracy to view even more information about what each of these threads is doing. Please see the Users Guide for more information on how to use this tool with VR-Forces.